α Cyg - 124 amateur spectra of a pulsating supergiant
A second real-world walkthrough of spectro-kernel, complementary to the
α Dra binary case. Deneb (α Cyg, A2 Ia) is
not a binary - it's the prototype of the α-Cygni variables: a
non-radial pulsating supergiant whose H-α profile is also shaped by an
ionised stellar wind. Where α Dra gave a single clean orbital period, α
Cyg exhibits low-amplitude, multi-periodic, sometimes irregular
variability on timescales of weeks. This notebook applies the same kernel
pipeline as the α Dra case and honestly reports what amateur data of a
genuinely harder target can and can't deliver.
The complete script is at
playground/analyse_alpha_cyg.py.
Dataset provenance
The 124 FITS files come from an amateur monitoring campaign of Deneb run
between 2020 and 2024 (~12 contributing observers, slit spectrographs
typically R ≈ 5 000–20 000 centred on H-α). The data is not bundled
with this repository - drop your own FITS into
playground/datas/alphacygni/ and the script picks them up automatically.
If you contributed spectra to or reuse spectra from a public archive, please cite the relevant campaign. Personal observer attributions have been omitted from this notebook - the kernel showcases the analysis pipeline, not the source of any specific measurement.
The pipeline
Identical to the α Dra one - same algorithms, same defaults:
from spectro_kernel import WorkContext, run_algorithm
from spectro_kernel.io import read_fits

ctx = WorkContext(spectrum=read_fits(path))
run_algorithm("snr_der", ctx)
run_algorithm("normalize_polynomial", ctx, {"order": 3})
run_algorithm("fit_gaussian_line", ctx,
              {"line_center_angstrom": 6562.81, "window_angstrom": 30.0})
# Embedding restricted to H-α ± 50 Å for similarity comparison
region = ctx.copy()
run_algorithm("extract_region", region,
              {"wavelength_min": 6512.81, "wavelength_max": 6612.81})
run_algorithm("embed_spectrum", region, {"dim": 128, "strategy": "dct"})
124/124 spectra pass the basic SNR/RV sanity filter - Deneb is bright enough that even modest amateur setups give usable spectra.
Result 1 - RV vs time
Centroid of the H-α Gaussian fit, converted to radial velocity (km/s), median-subtracted:
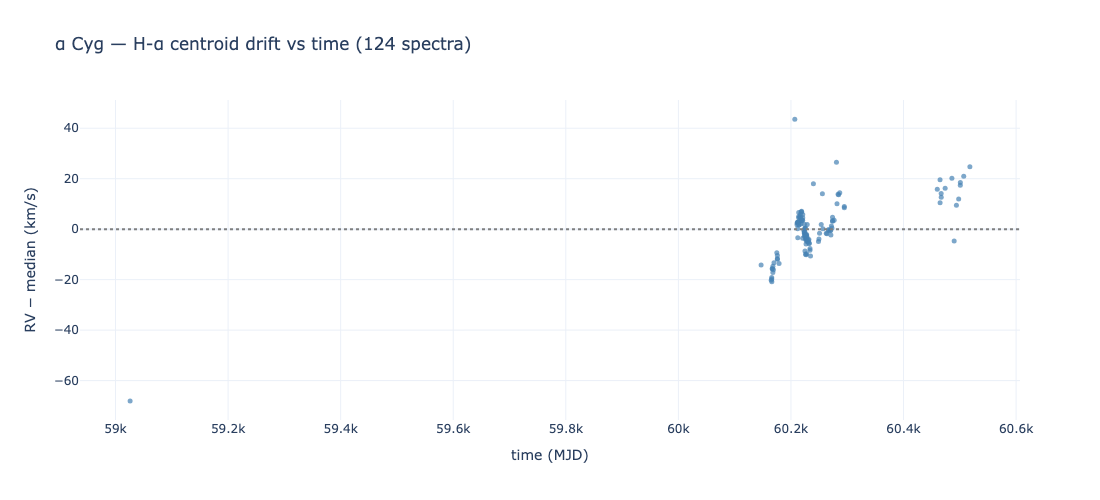
The series shows two main observing campaigns (a dense 2023 cluster around MJD 60 100–60 250, and a 2024 cluster around MJD 60 400–60 550) plus a few isolated 2020 / 2023-summer points. Within each campaign, RV scatter is ~±20 km/s, consistent with α Cyg-variable pulsation amplitudes documented in the literature. Between campaigns, there is a systematic offset (the 2024 mean RV sits ~15 km/s above the 2023 mean) that could be a real long-term modulation OR an instrument-mix effect between observers - the kernel can't tell those apart.
Result 2 - Periodogram (and an honest caveat)
Lomb-Scargle on the (time, RV) pairs:
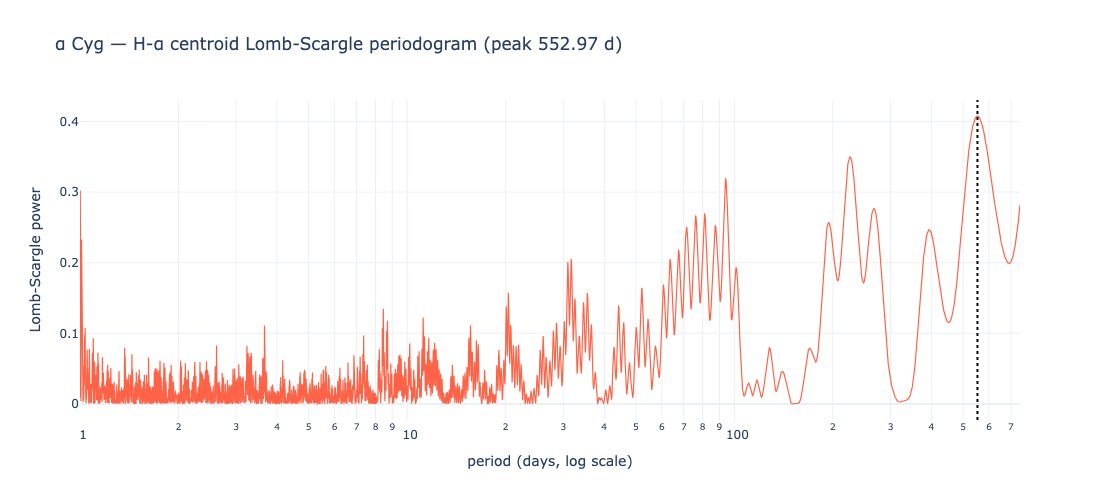
The dominant peak sits at ~553 days, but this is largely a sampling artefact rather than a stellar period: it corresponds to the spacing between the two observing campaigns. The genuine α Cyg-variable pulsations have published timescales of ~11–100 days; the periodogram shows enhanced power in that range too (the bumpy plateau between 30 and 100 days) but no single sharp peak - exactly what's expected from a multi-periodic, semi-coherent pulsator observed at heterogeneous cadence.
Take-away. A periodogram on amateur data is a measurement, not a truth. The kernel reports what's in the data without lying; turning that into astrophysics requires a critical eye on the sampling. For α Dra (single clean binary period, ~4 cycles densely sampled) the periodogram nails it. For α Cyg (multi-periodic, unevenly sampled), the answer is "yes there's variability on 10–100 day scales, no single period dominates".
Result 3 - H-α profile gallery
The H-α region of every spectrum, overlaid:
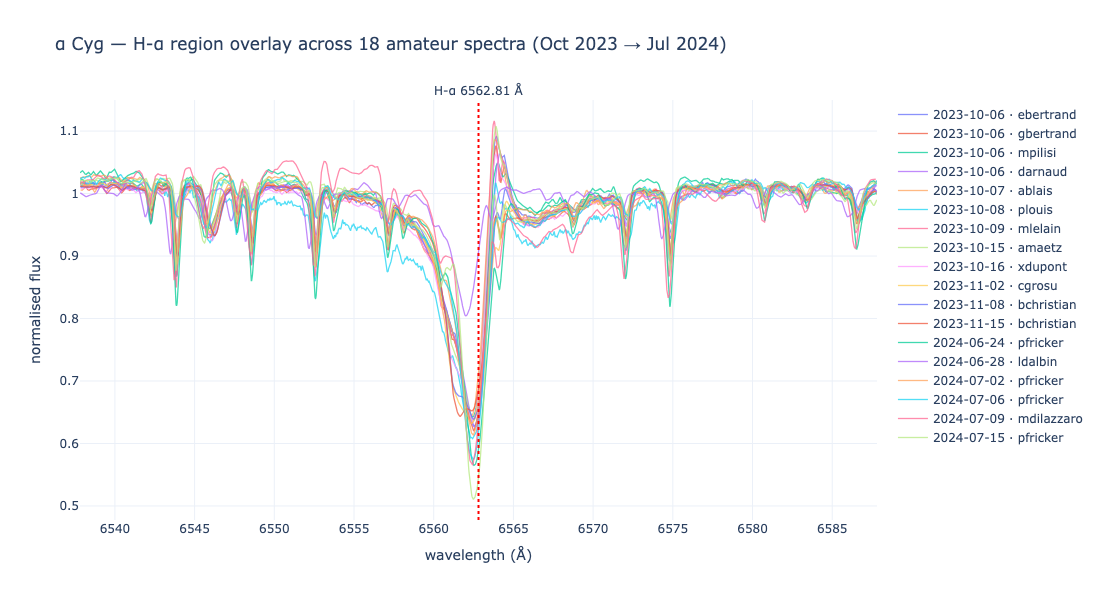
Most spectra share the same characteristic A-supergiant H-α absorption profile, with the small profile variations expected for α Cyg-variables. A handful of low-SNR observations and a few obvious mis-calibrations stand out - visible without any per-file labelling, just from the spread of the flux trace.
Result 4 - Embedding latent space
Each H-α region is embedded to a 128-d vector via embed_spectrum
(strategy="dct"); the 124 vectors are then PCA-projected to 2D, with
each point coloured by its phase at the periodogram's best period:
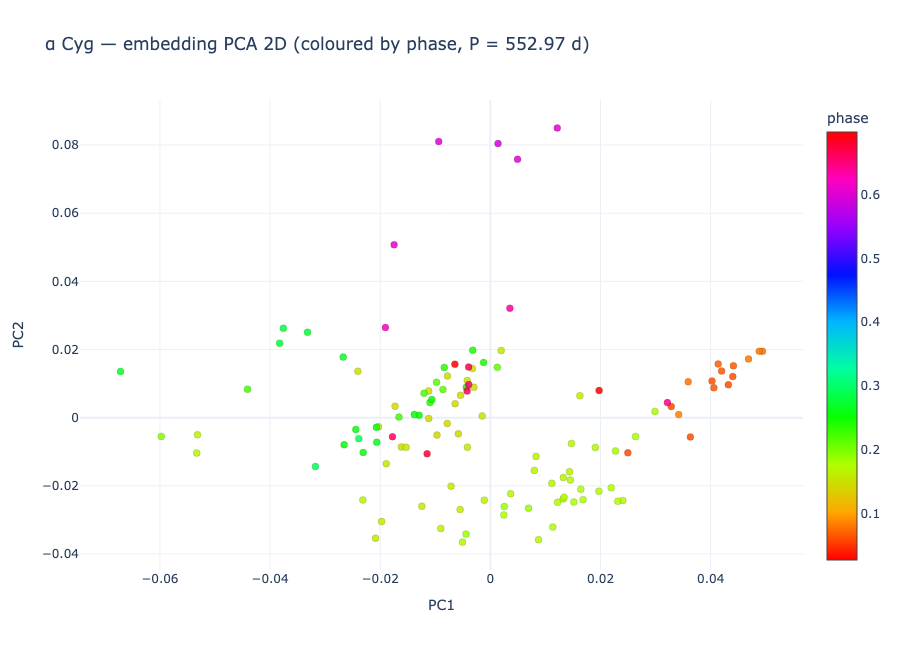
There is a colour gradient (early phases at right, mid phases at centre, late phases scattered at top) but it's far less clean than the α Dra version - because the underlying period isn't really 553 days, it's a mix of shorter-scale pulsations and a sampling artefact. The embedding's latent axes still capture the most variable directions of the dataset - but with α Cyg those don't align with one single phase like they did with α Dra's clean orbit.
What you actually learn from this dataset
- Sub-day RV scatter of ~20 km/s within each observing campaign, consistent with low-amplitude pulsations of an A Ia supergiant.
- A long-term offset between 2023 and 2024 campaigns that requires inter-instrument cross-calibration to interpret astrophysically.
- No single dominant pulsation period - α Cyg-variables are known to be multi-periodic / quasi-periodic, and a 4-year amateur monitoring is consistent with that.
- The kernel pipeline reports all of the above without any Deneb-specific tuning - same six algorithm calls as the α Dra binary notebook, applied to 124 files instead of 240.
Reproducing this
cd playground
python3.12 -m venv venv && source venv/bin/activate
pip install -e "..[viz]" plotly kaleido
# drop your own alphacyg_*.fits files in playground/datas/alphacygni/
python analyse_alpha_cyg.py
# → output/alpha_cyg_*.png + alpha_cyg_summary.csv
Takeaway compared to α Dra
| α Dra (binary) | α Cyg (supergiant pulsator) | |
|---|---|---|
| Underlying physics | single Keplerian orbit | multi-periodic pulsations + wind |
| Expected RV signal | clean ~120 km/s sinusoid at 51 d | semi-coherent ~±20 km/s on 10–100 d |
| Periodogram outcome | single sharp peak at 51.6 d | broad plateau + sampling-driven peak |
| Phase-folded curve | clean asymmetric loop (eccentric orbit) | mostly noise at any candidate period |
| Embedding latent space | PCA axis = orbital phase | PCA axis = mixed variability + outliers |
These are the right behaviours given the underlying physics - the kernel doesn't try to force a periodicity on a star that doesn't have a clean one. The same pipeline tells two different stories from two different datasets, faithfully.